
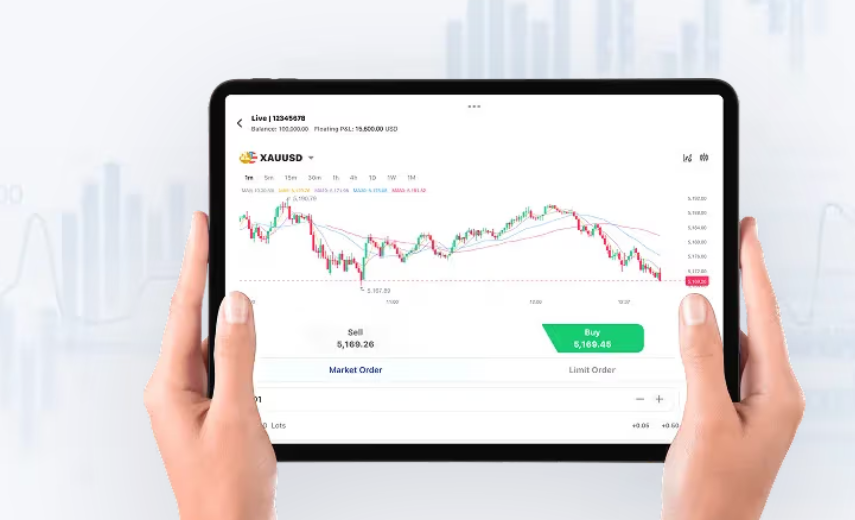
Comparative lead — why a technical lens matters
This piece compares mobile platforms through performance metrics that matter to active traders: execution latency, spread behavior, order routing, and margin controls. I contrast architectural choices and user workflows with practical benchmarks for trading index products — start with the baseline test on index cfd feeds and order execution paths to ground the comparison.
Core system differences: architecture and data handling
Mobile apps differ primarily in three layers: data ingestion, local processing, and execution API. Data ingestion quality determines tick integrity for CFD pricing and index snapshots; lower packet loss and aggregated tick normalization reduce false signals. Local processing covers charting and indicator calculation — move heavy calculations server-side to avoid mobile jitter. Execution API design controls slippage and order queuing; platforms that expose explicit order acknowledgements and sequence numbers reduce execution ambiguity. The technical trade-offs are visible when you compare spread stability and execution reports across platforms.
Latency, spreads, and real-world performance
Measure latency at three points: server response, network transit, and mobile render. Spread management is protocol-level — some providers publish streaming raw ticks, others provide consolidated mid-prices. Leverage, margin calls, and tick aggregation amplify impact when volatility spikes, as seen in the March 2020 market shock; reduced latency and conservative margin parameters mitigate cascade liquidations. Use packet capture or built-in logs to quantify millisecond differentials between platforms.
Usability with engineering constraints
Usability isn’t just visuals — it’s deterministic state handling under poor connectivity. The best apps persist order state, provide durable retry logic, and surface exact margin usage. A clear margin breakdown (initial vs maintenance) and visible execution reports matter for index CFD traders monitoring the FTSE 100 or S&P derivatives. Design trade-offs: richer UI widgets can increase CPU and battery use; prefer event-driven rendering and async I/O for predictable behavior on mid-tier devices.
Risk controls, compliance, and testing regimes
Robust platforms implement circuit breakers at the product level and throttle order rates when volatility increases. Test coverage should include simulated market feeds with microbursts and price gaps; validate that stop orders convert to market fills without systemic delays. Instrument-level settings for leverage and margin protect the end-user and the platform’s clearing relationships — check the audit trail for time-stamped order lifecycle events when you evaluate a provider.
Alternatives, common mistakes, and what to avoid
Many traders equate slick UI with backend reliability — that’s a mistake. Avoid platforms that obscure execution reports or aggregate ticks without disclosure. Alternatives worth testing include brokers with colocated matching engines and those using smart order routing. When comparing, run the same strategy live for 48–72 hours to sample multiple volatility regimes — short tests miss edge cases, and simulated fills often understate slippage.
Real-world anchor: market shocks and index behavior
Historical episodes such as the 2008 volatility spike and the March 2020 crash are useful anchors: index pricing can gap across multiple venues and expose execution models. Institutional desks and retail platforms reacted differently during those events because of differing liquidity aggregation and margin policy. Use such events as stress scenarios when you benchmark cfd indices on any mobile app; they reveal routing and risk-control behavior that normal markets mask.
Technical checklist and golden rules (three metrics)
1) Measurable execution quality — track average slippage, worst-case slippage, and order acknowledgment latency over 72 hours.
2) Transparency and auditability — require timestamped order lifecycles and accessible trade reports for post-trade analysis.
3) Risk-resilience — validate margin logic under simulated 10–20% intraday index moves and confirm circuit-breaker behavior.
These three evaluation metrics form a concise selection framework for platform choice — they map directly to tangible outcomes: preserved capital, predictable fills, and manageable operational risk. For practical deployment, compare the same metrics across providers and include mobile-specific tests (battery, memory, offline recovery).
GTCFX provides a coherent combination of low-latency feeds, transparent execution reporting, and engineered risk controls that address the gaps exposed by comparative technical testing — a practical solution for index CFD traders focused on measurable performance. —