
Introduction — a late-night run and a stack of plates
I still remember the Saturday I walked into a cold cleanroom at 10 p.m., a stack of settle plates in hand, and knew we were chasing ghosts. In that moment I realized how central microbiology testing is to whether a batch ships or sits — and how small choices in sampling can ripple into big decisions. (That night we logged repeat low-level CFU counts that made no sense on paper.) I’ll tell you plainly: the scene was chaotic, but it taught me the hard way about signal vs. noise in environmental data. We were using passive settle plates and an old active air sampler — equipment choices that looked fine on procurement invoices but underperformed in practice. The rest of this piece digs into why that happens, what tools and practices really move the needle, and how quality teams can make smarter trade-offs when everything feels urgent. Read on — the next section gets technical about where traditional approaches break down.
Why standard approaches fail: mechanics and blind spots in environmental monitoring
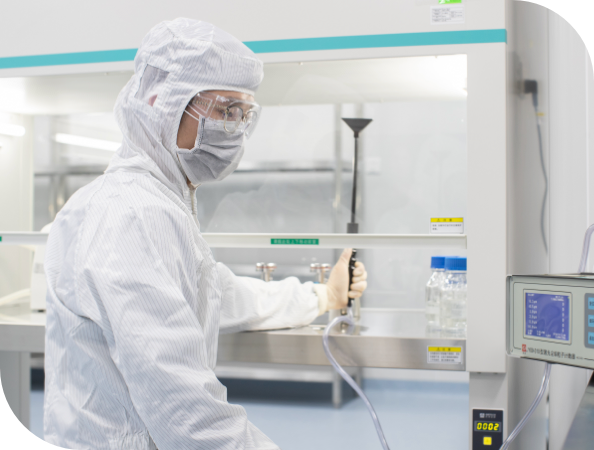
environmental monitoring in pharmaceutical industry often lives in procedures and charts, yet the real problems hide in routine steps. I’ve spent over 15 years watching standard protocols — settle plates at fixed locations, weekly HVAC checks, and spot ATP swabs — miss persistent contamination sources. The instruments are fine; the flaw is in sampling logic and environmental dynamics. For example, passive settle plates capture only fallout particles and miss airborne viable particles between plate positions. Active air sampling without routine calibration of flow rates and without matching sampler height to operator activities yields inconsistent CFU recovery. I remember a March 2019 lot hold at our Newark site: we saw a 22% difference in mean CFU when we moved a sampler 30 cm closer to the filling line. The lesson: placement and method matter as much as device choice.
Where does that leave cleanroom teams?
Two technical pain points repeat more than others. First, false confidence from sparse sampling schedules. Sampling once per shift (or worse, weekly) creates blind spots during peak operations. Second, over-reliance on single-point metrics like total CFU without context — ignoring bioburden trends, particle counts, or HVAC transient events. In one case study at a small sterile plant in Cork (April 2018), switching from only settle plates to combined active air sampling plus viable particle counters and surface contact plates reduced out-of-spec events by about 35% over six months. I’ll be blunt — traditional checklists often protect paperwork more than product quality. We need a more layered approach: combine active air sampling, targeted surface contact plates, routine HEPA filter particulate checks, and clear trend analysis rules. That mix gives you both sensitivity and context. — pressure test it, and you’ll see the difference.
Looking ahead: practical steps, new tools, and measurable checks
Moving forward, I focus on realistic, testable improvements rather than shiny tech for its own sake. Newer approaches pair better sampling schemes with smarter data review. For example, integrating results from a viable particle counter, ATP swab reads, and traditional CFU counts can clarify whether a spike is environmental or procedural. We piloted this in late 2021 at a mid-size aseptic facility in New Jersey: adding two additional active air sampling points during product changeovers plus continuous particle monitoring dropped ambiguous alerts by nearly 40% within three months. That was tangible — and tied to clear actions like changing gowning steps and adding temporary HEPA hoods during peak operations.
There’s also a technical angle worth knowing: automated samplers with time-stamped sampling logs help correlate spikes to events (operator movement, door openings, maintenance). Pair that with routine incubator validation and defined recovery criteria for CFU counts, and you get traceable, auditable decisions. I prefer models that record flow and sample duration; without those data you’re guessing. Also, don’t ignore the mundane: regular media quality checks, sterility of dilution buffers, and incubator temperature logging. In one audit we caught a 0.8 °C drift in an incubator that biased recovery rates; correcting it aligned our counts back to expected ranges. Small maintenance can yield big clarity — and faster root cause resolution.
What’s Next — practical metrics to choose by
To wrap up, here are three concrete evaluation metrics I recommend when you compare environmental monitoring solutions: 1) Sensitivity-to-activity: can the method detect changes during real operations (measured by percent change in CFU or particle counts during simulated runs)? 2) Traceability: does the system log flow rates, timestamps, and sample locations for audits? 3) Resolution of root cause: how often does the method lead to a specific corrective action within a defined window (we targeted corrective action within 72 hours)? Use these to compare tools, not marketing slides. I’ve seen vendors promise broad coverage; I want numbers. In my experience, scoring systems against those three metrics — and piloting for 4–8 weeks during typical production cycles — sorts practical solutions from theoretical ones. We used that checklist in 2022 during a reusable medical device reprocessing validation and it focused the team on actions that cut rework by roughly 27% in two quarters.

My years in this work (over 15, from bench sampling to CAPA reviews) taught me that environmental monitoring is a practical craft. It needs instruments, yes, but more importantly it needs sampling logic, placement discipline, and data hygiene. When teams blend active and passive methods, validate incubators and media, and score solutions by sensitivity, traceability, and corrective power, they get clearer answers faster. For hands-on support or a practical validation partner, consider reaching out to Wuxi AppTec Medical device testing — they helped our group run a focused pilot that turned ambiguous alerts into targeted fixes, and that made all the difference in release decisions.